The EDC15 is a much used ECU in “semi-modern” diesel cars like golf 4 TDI from 2000 on. It is used in much more cars, but in the example’s i give i used a 150hp golf 4 TDI. Winols is used to change the maps. Some EDC15 ecu’s do have more software banks, in my case there were 2 banks of software. There is only one of the two active at a moment but i decided to change both banks. Some ecu’s have even 3 or 4 banks. So just to be sure, change all banks exact the same (Winols will do this automatically).
Preparations:
WinOLS Video+PDF Tutorial Download
What is ECU Map? How to Understand ECU Maps?
WinOLS Free Download for Win XP/Win 7 Installation
How to Make Checksums for ECU Files with WinOLS
Map explanations:
The different maps of the EDC-15 can be grouped in 2 groups. The fuel related maps and the turbo related maps. As the name says the fuel related maps control the quantity of injected fuel, and the turbo maps control the turbo pressure. All examples in this document are taken from an original VW Golf IV TDI PD 150hp.
Fuel related maps:
-(EGR map) not really a fuel map, but have to put it somewhere.
Turbo related maps:
Fuel related maps
General:
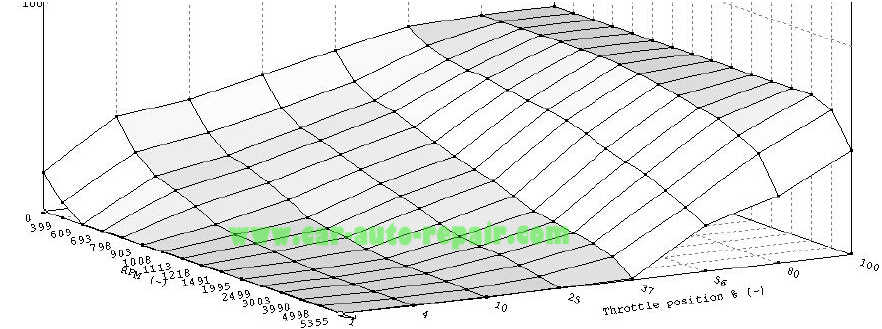
This map shows the required injected quantity diesel into the engine depending on the RPM and the Throttle position. The output of this map is injected quantity (IQ) in mg diesel/stroke.
3D view of the drivers wish map
Factors & offsets:
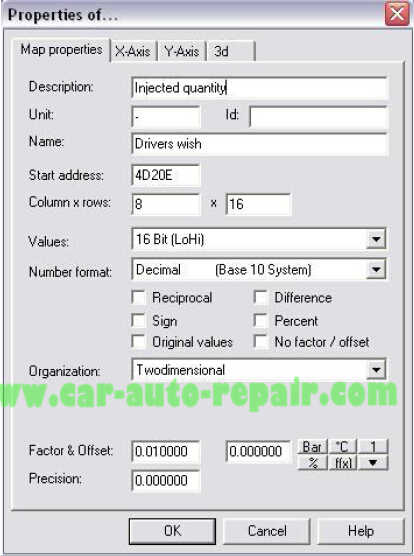
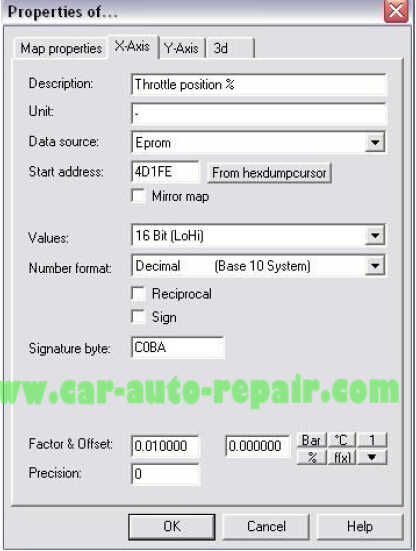
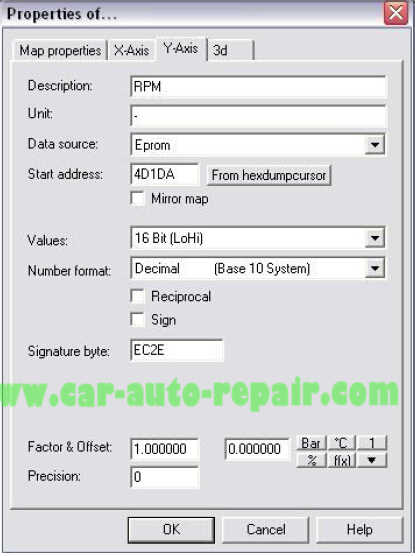
All factors, offsets, axis descriptors and names are given by the pictures below.
The factor and offset from the map drivers wish
The properties of the X axis of the map drivers wish
The properties of the Y axis of the map drivers wish
General:
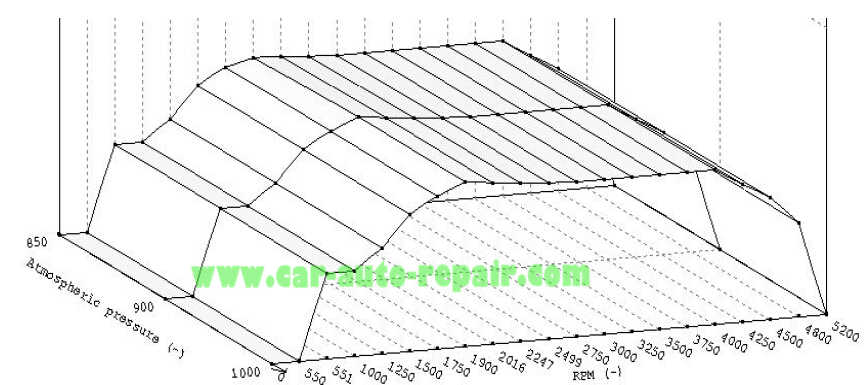
This map limits the torque of the engine based on RPM and atmospheric pressure. The output of this map is also mg diesel / stroke.
3D view of the Torque limiter
Factors & offsets:
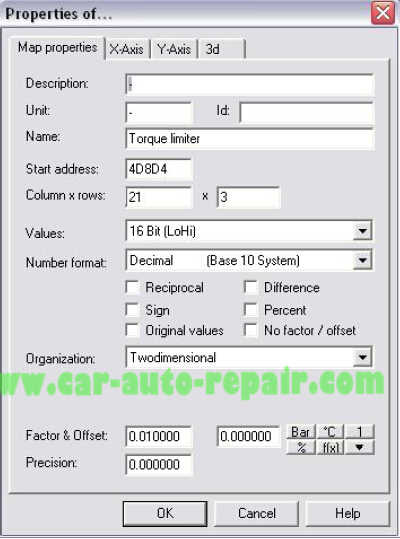
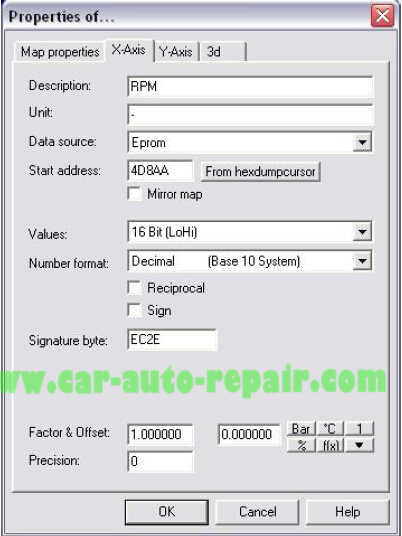
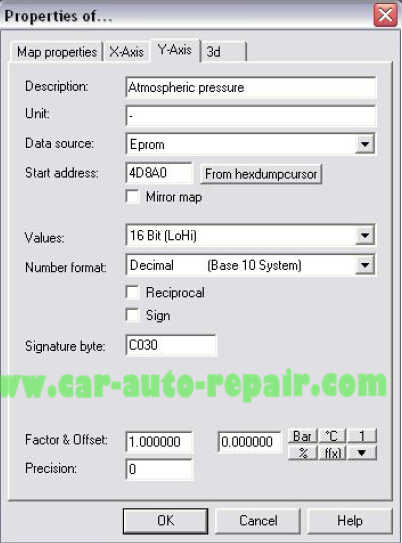
All factors, offsets, axis descriptors and names are given by the pictures below.
The factor and offset from the Torque limiter
The properties of the X axis of the Torque limiter
The properties of the Y axis of the Torque limiter
General:
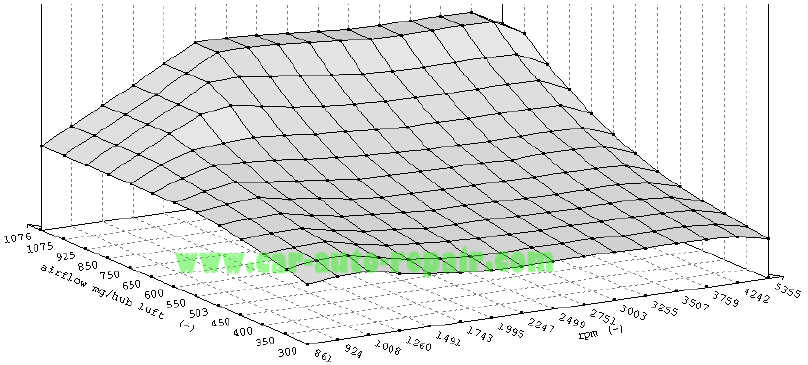
This map limits the injected quantity based on RPM and inlet air. So if the drivers wish is 50mg,and there is only enough air to burn 45mg diesel, it won’t inject 50mg but limit injection at 45mg/stroke.
3D view of the Smoke limiter
Factors & offsets:
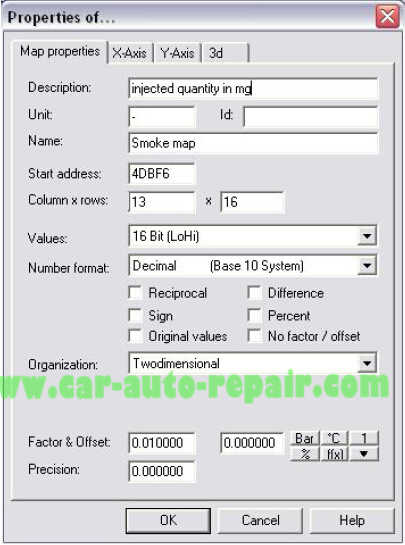
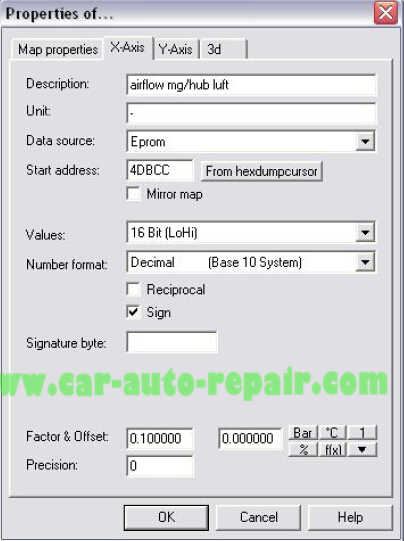
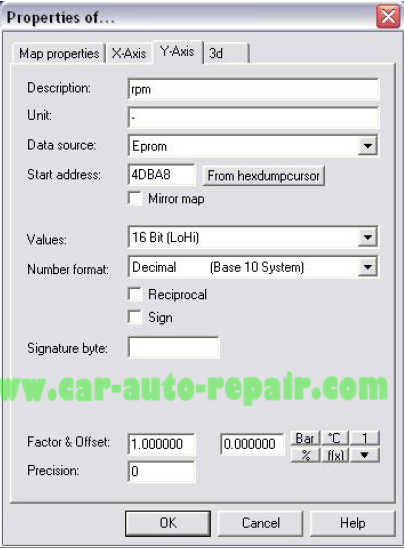
All factors, offsets, axis descriptors and names are given by the pictures below.
The factor and offset from the Smoke limiter
The properties of the X axis of the Smoke limiter
The properties of the Y axis of the Smoke limiter
General:
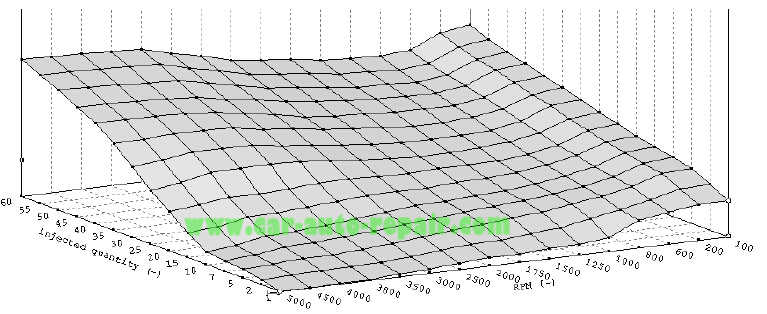
This map shows how much degrees engine rotation it takes to achieve the amount of fuel injected. So this is a “calibration” map. Often there is more than one duration map, in case of the 150hp tdi even 4. There are 4 maps for different coolant temperatures etc.
3D view of the Duration map
Factors & offsets:
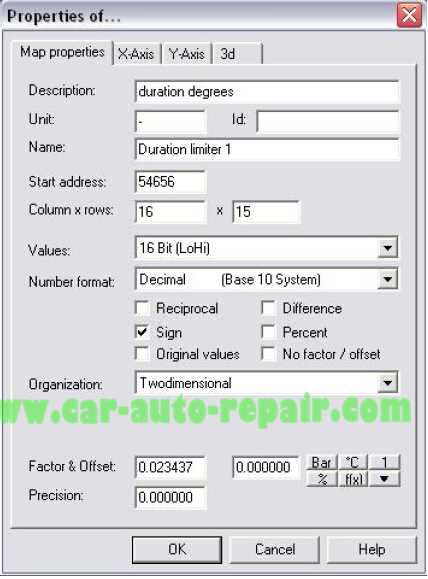
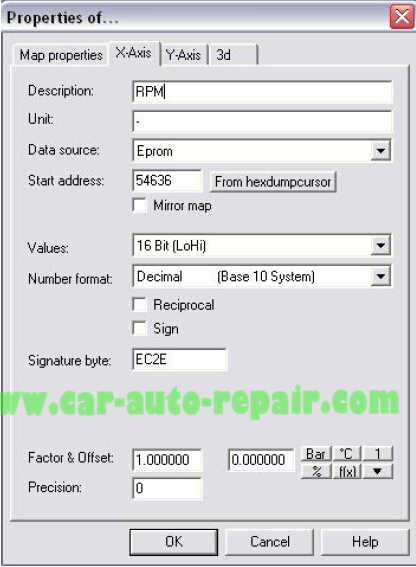
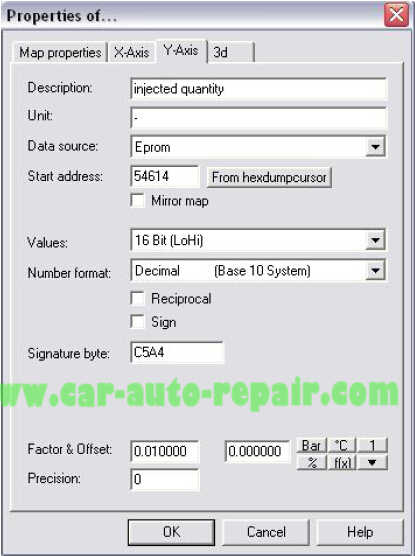
All factors, offsets, axis descriptors and names are given by the pictures below.
The factor and offset from the Duration map
The properties of the X axis of the Duration map
The properties of the Y axis of the Duration map
General:
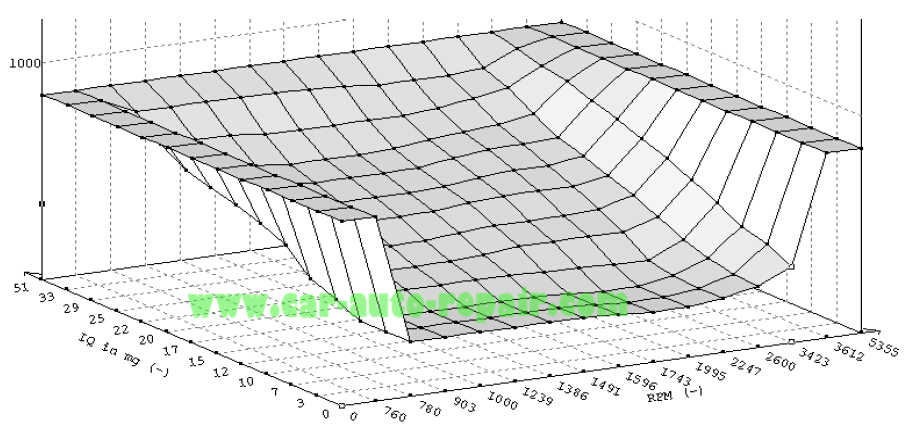
This map regulates the Exhaust gas recirculation valve.
3D view of the EGR map
Factors & offsets:
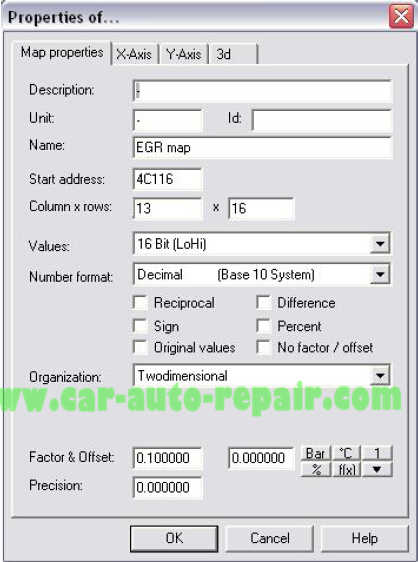
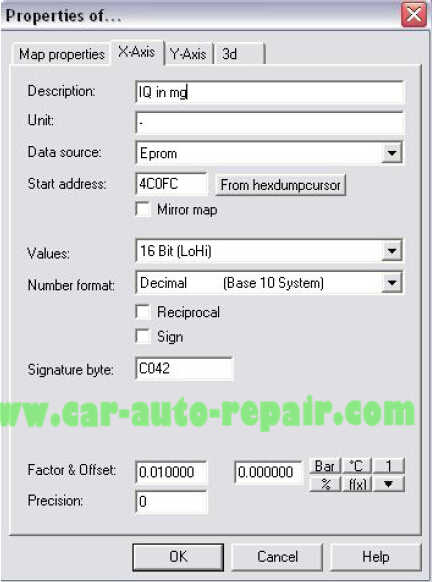
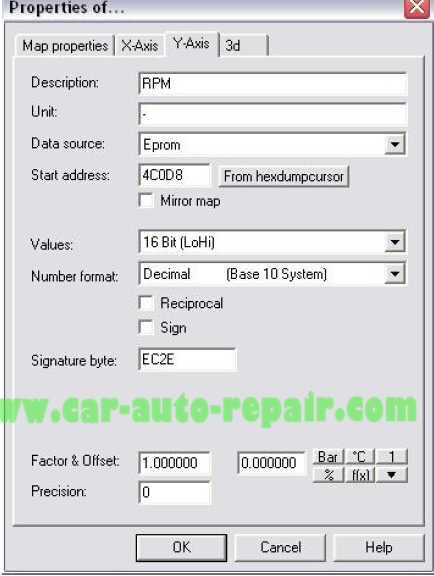
All factors, offsets, axis descriptors and names are given by the pictures below.
The factor and offset from the EGR map
The properties of the X axis of the EGR map
The properties of the Y axis of the EGR map
Torque limiter:
If we want to tune a stock PD engine it is enough to change the torque limiter, smoke limiter,duration map and the EGR map (and the turbo maps but that comes later on). The drivers wish can stay the same for stock car tuning. The torque limiter can be increased from 1250rpm to 4800rpm by ± 25%. The highest value should be around 2250-2750rpm.
To give an example look at the picture below. It is an original text view of the torque limiter.
The original torque limiter

The modified torque limiter can look something like the picture below.
The modified torque limiter

Smoke limiter:
As you can see the values (mg/stroke) are increased. At this point the smoke limiter will still limit the IQ. So we need to change the smoke limiter as well. We only want to change the smoke limiter at high IQ’s. Original the text view of the smoke map looked like the picture 6.3.
The original smoke limiter
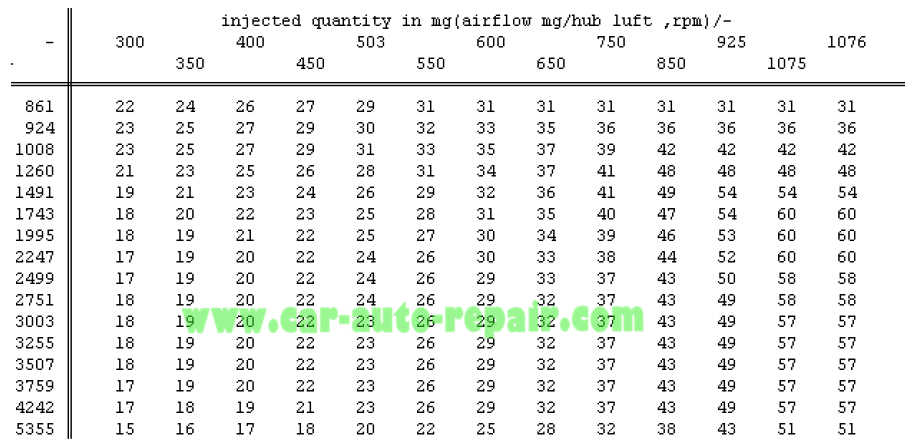
At full throttle only the higher airflow parts will be used. You can see that even if we change the torque limiter to 70mg/stroke at 2500rpm the smoke limiter will limit this value back to 58mg/stroke.
That’s the reason why we need to change the smoke limiter. To change the smoke limiter not too much (we don’t want to smoke a lot). The air fuel ratio at which not too much smoke appears is 1:17. So if we pick the value 1076 (highest value on smoke map scale) and divide that by 17 we get: 1076/17 = 63mg. So the max value in the most right column may be 63 mg/stroke. We made the torque limiter 70mg/stroke so we want to change the smoke map also to 70mg/stroke. But how do we do that without having lots of smoke behind the car?
The answer to that is: Change the axis descriptor to a value where 70mg/stroke is 1:17. So we do 70*17 = 1190. We make this 1200 to make it easy. You can see that the most right column looks almost the same as the torque limiter.
Then the smoke limiter looks like the picture below.
The modified smoke limiter
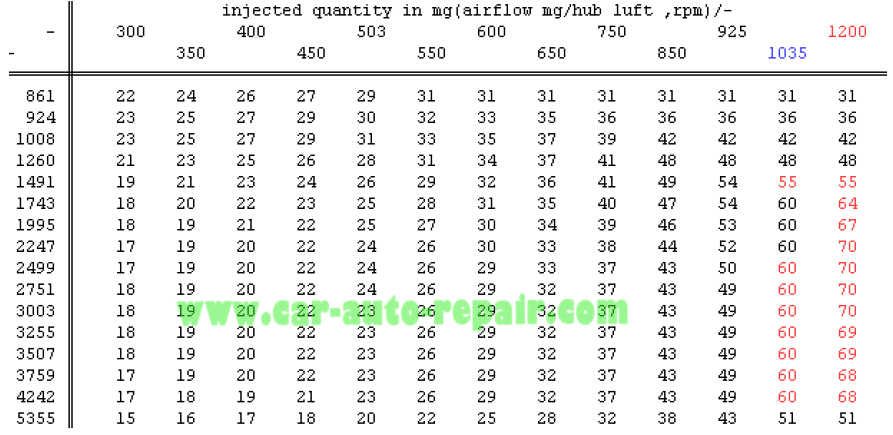
So the smoke map is changed. As you can see also the 1075 has been changed into 1035. This is done to give better precision at high airflows. This example also shows that the axis descriptors may be changed.
Duration map:
The duration maps do need to be changed also. Otherwise the duration map will limit the injected quantity at the highest possible axis. So we need to change the axis value from 60mg/stroke to 70mg/stroke in this case. And also we need to set the pump voltage higher by the same factor we changed the axis descriptor.
EGR map:
To prevent clogged intake and avoid unnecessary smoke the EGR map have to be disabled. The
original EGR map looks like picture as below.
The original EGR map
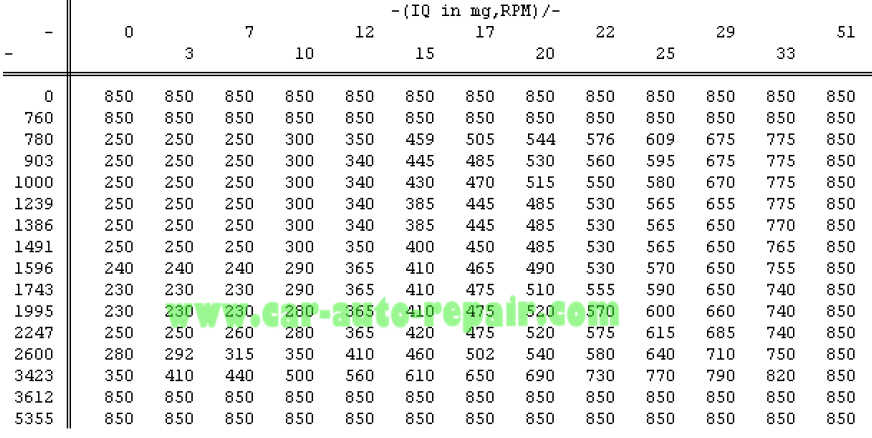
How to disable the EGR map? Pick the highest value from the map, and make the whole map the highest value. In This case it is 850, so we change all values to 850 as showed in picture as below.
The modified EGR map
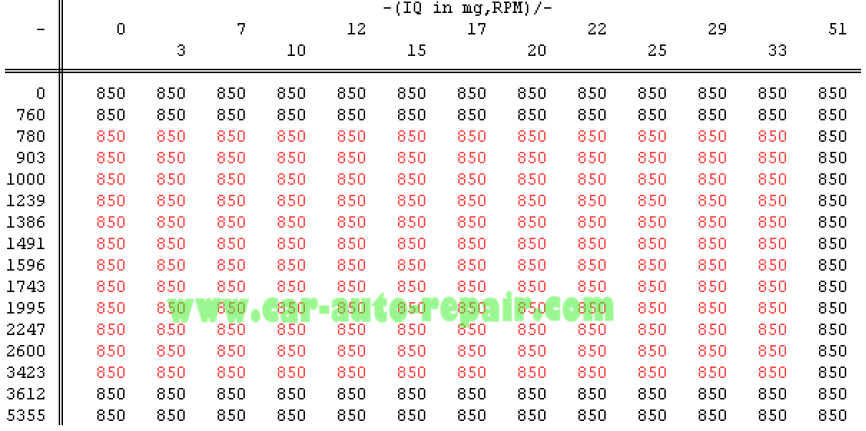
At this point all fuel related maps have been “tuned”. We will continue with tuning the turbo related maps after explaining the basics of those maps.
Turbo related maps
General:
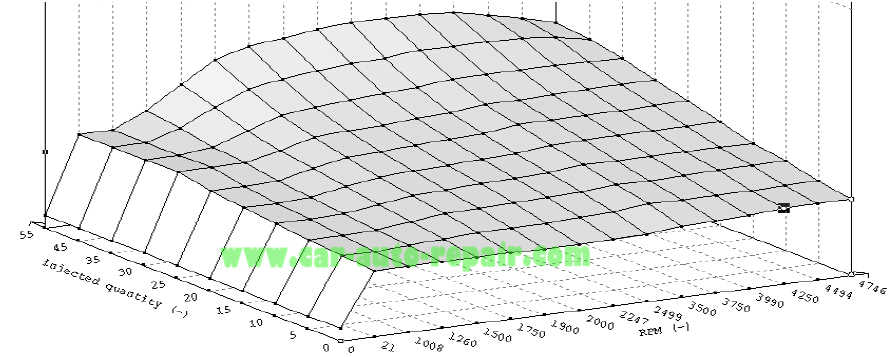
This map shows the desired turbo pressure at a certain rpm and injected quantity. The output of this map is turbo pressure in mbar.
3D view of the turbo map
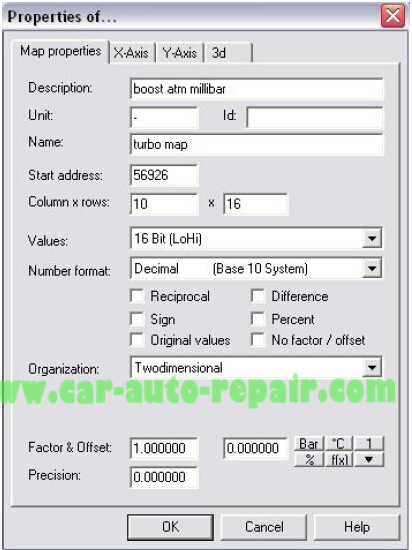
Factors & offsets:
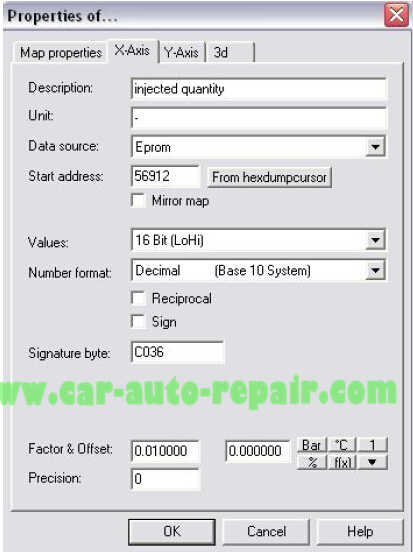
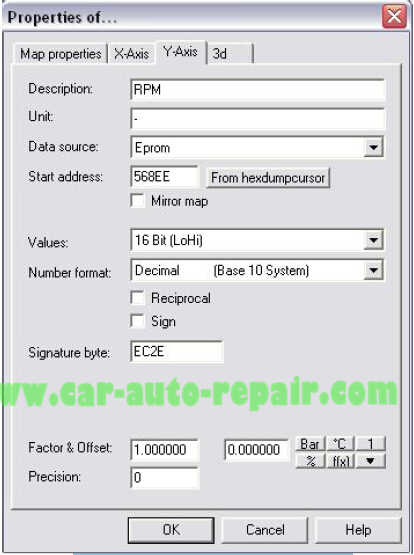
All factors, offsets, axis descriptors and names are given by the pictures below.
The factor and offset from the turbo map
The properties of the X axis of the turbo map
The properties of the Y axis of the turbo map
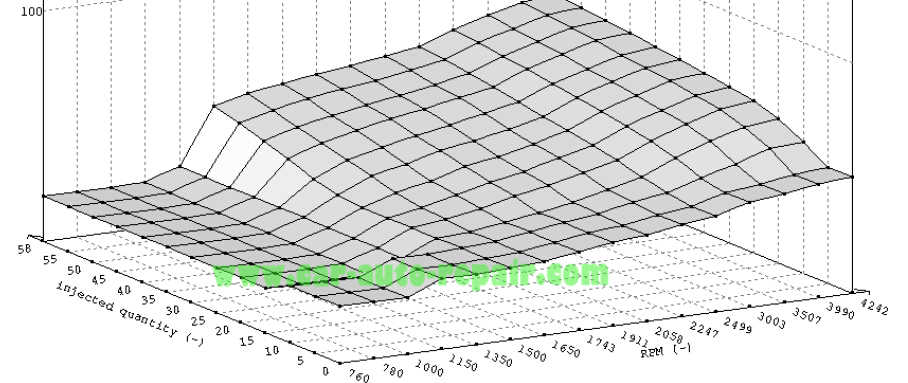
General:
This map controls the vanes inside the turbo at a certain rpm and injected quantity.
3D view of the N75 map
Factors & offsets:
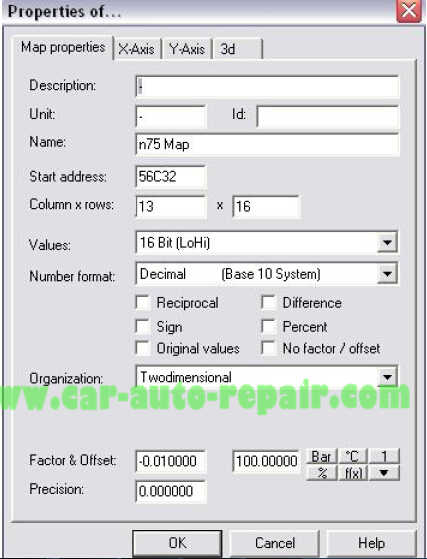
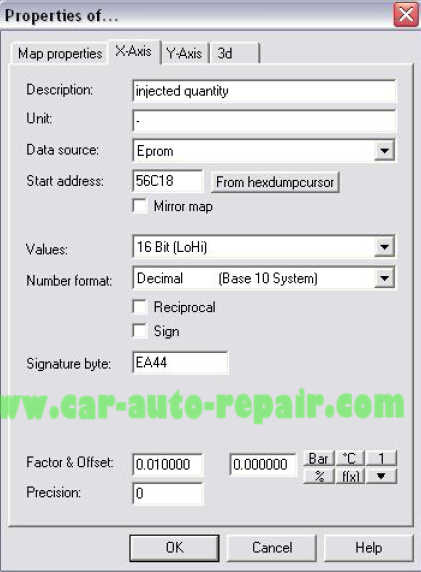
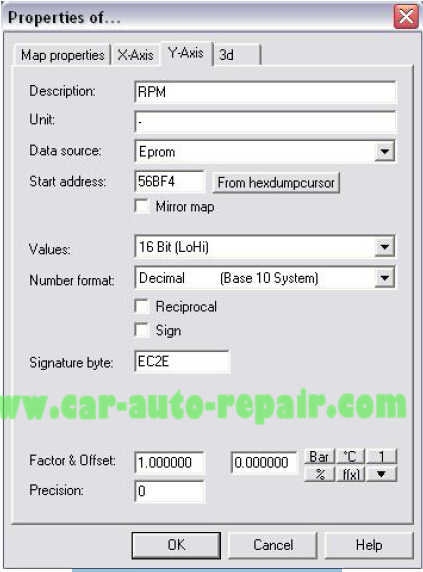
All factors, offsets, axis descriptors and names are given by the pictures below.
The factor and offset from the N75 map
The properties of the X axis of the N75 map
The properties of the Y axis of the N75 map
General:
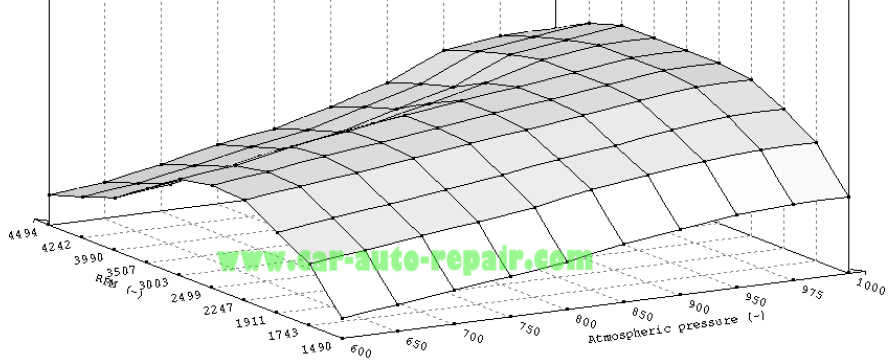
This map limits the turbo pressure at a certain rpm and atmospheric pressure. The output of this map is again in mbar turbo pressure.
3D view of the boost limiter map
Factors & offsets:
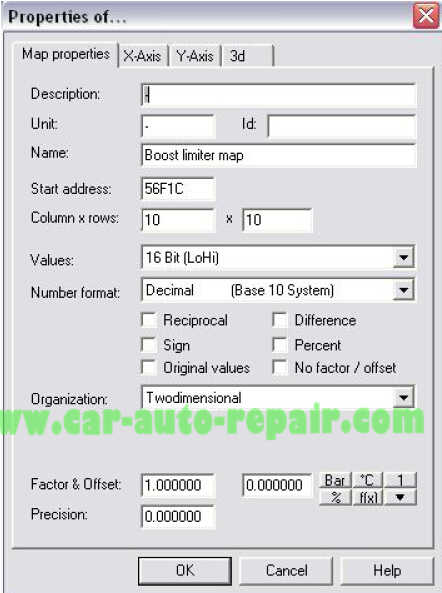
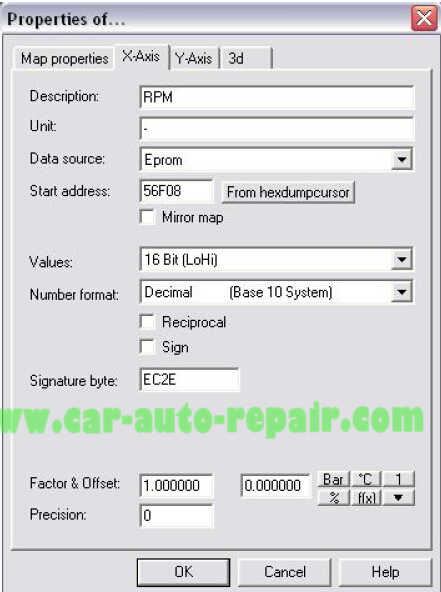
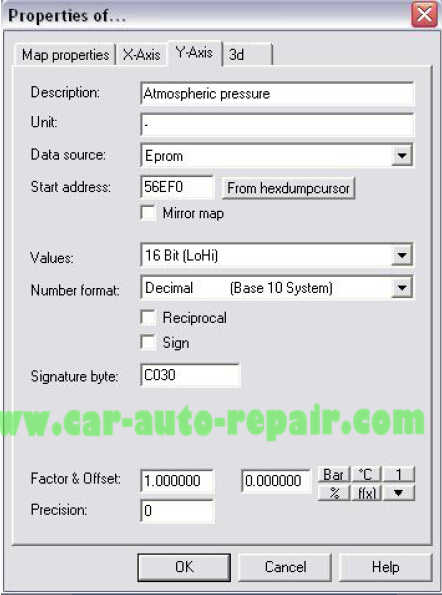
All factors, offsets, axis descriptors and names are given by the pictures below.
The factor and offset from the boost limiter map
The properties of the X axis of the boost limiter map
The properties of the Y axis of the boost limiter map
10.Single value boost limiter:
General:
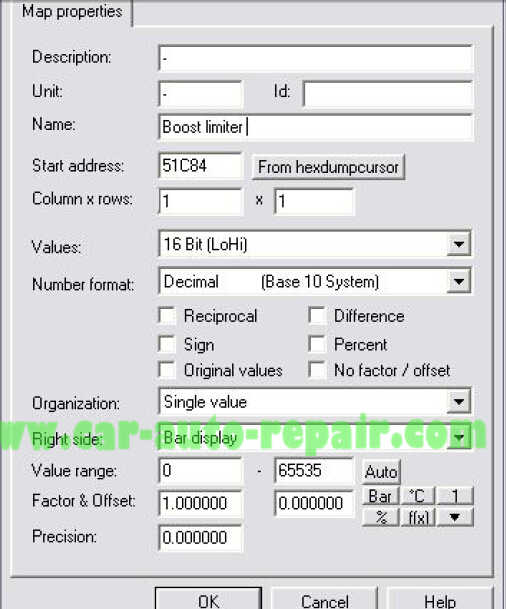
This value limits the absolute pressure. The boost will (normally) never be higher as this value.To find this single value just look for the value 31455(decimal) or 7ADF(hexidecimal). The boost limiter is located in front of this value. The stock value for the 150 hp TDI is 2620mbar.
Factors & offsets:
All factors, offsets, axis descriptors and names are given by the pictures below.
The factor and offset from the single boost limiter value.
Turbo map:
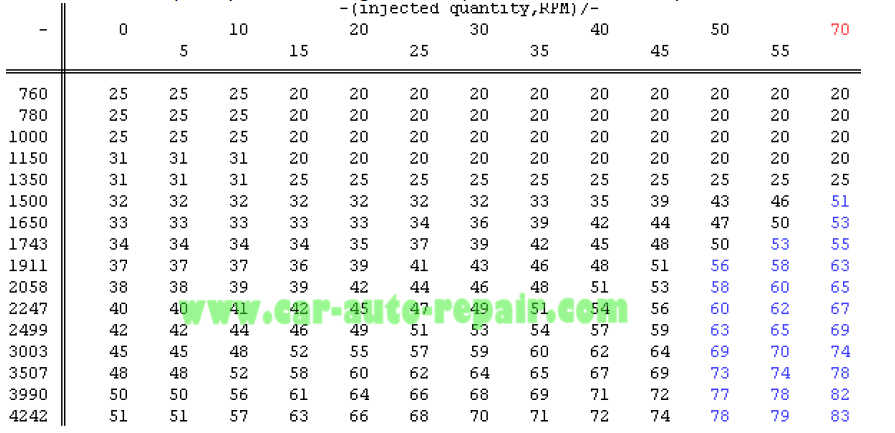
If we want to tune a stock PD engine we need to change besides the fuel related maps also the turbo related maps. We will start by modifying the turbo map. The original map looks like picture as below.
The original turbo map.
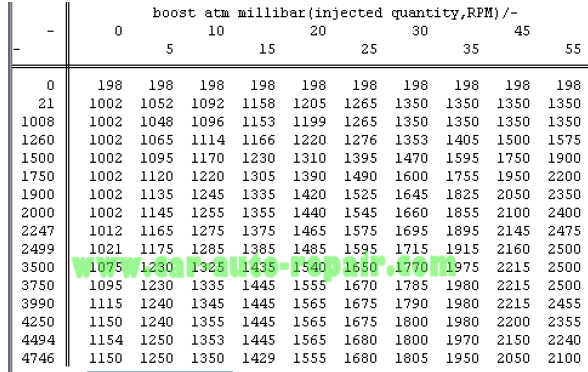
As you can see the boost goes up to max 2500mbar. The turbo on this car, a GT1749VB, can handle a max boost of around 2650-2700mbar. So the max value in this map may be 2650mbar.Since we are only tuning for max power only the most right column has to be changed. This turbo pressure is only for the 150hp version TDI. The lower hp versions have also lower turbo pressure! you can say that the turbo pressure may be increased by around 7% max. As you can see the axis value only goes up to 55mg/stroke, while we are injecting 70mg/stroke (set in the torque limiter and smoke map). To compensate that we changed the axis values from 45 to 55 and the 55 value to 60mg/stroke. This way the turbo pressure at high IQ’s is easier to regulate.
The modified turbo map.
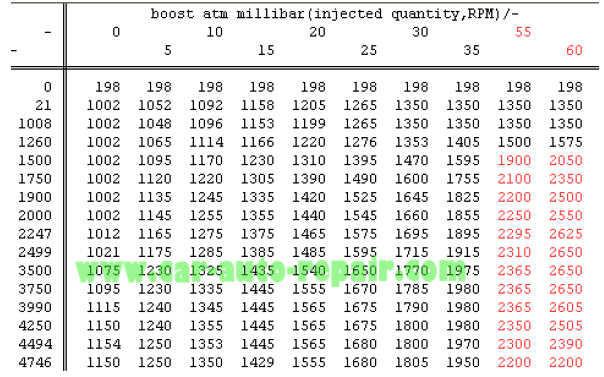
What happens with the value 70mg/stroke which is outside the limits? This will be the same as
the max axis value (in this case we made it 60mg/stroke).
N75 map:
The N75 map controls the vanes inside the turbo, and needs to be changed to prevent turbo
spiking. In the range 1500rpm up to 5000rpm at high IQ’s it needs to be higher. In picture 11.3
you can see the original n75 map.
The original N75 map.
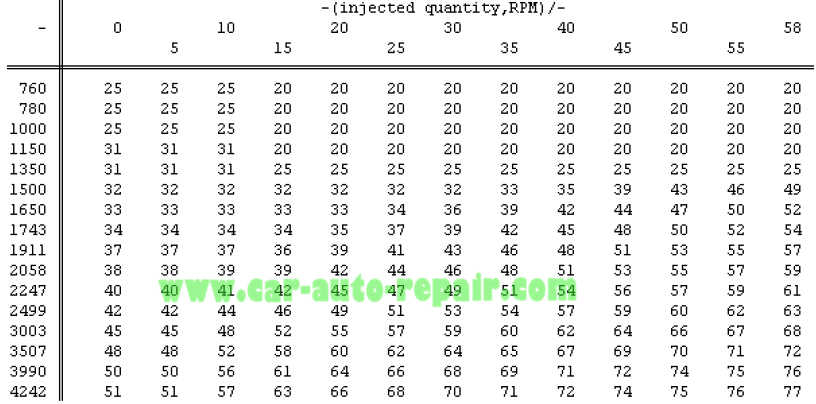
The modified N75 map look like picture as below. As you can see, again the axis value is changed into 70mg/stroke due to the torque and smoke limiter at 70mg/stroke. As a rule you can increase the values from 1500-5000rpm at high IQ’s by 8%. This is depending on the car, and how much boost spikes you have. still got boost spikes? increase the map.
The modified N75 map.
Boost limiter map:
At this point we have set the boost up to 2650 mbar in the turbo map, and prevent boostspikes by lowering the N75 map. But the boost limiter map will limit the 2650mbar back to 2500mbar as you can see in picture as below.
The original boost limiter map.
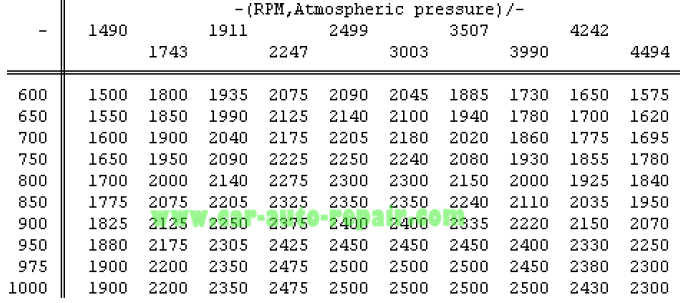
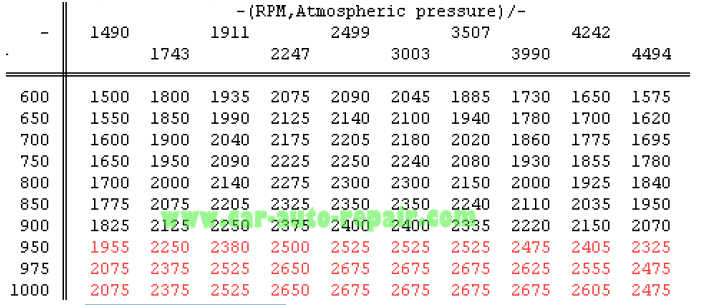
We need to change that values the same way as the turbo map, even a bit higher because this is the limiter. Since we only drive at sea level (1013,25hpa), there is no need to adjust the car at 900hpa and lower(or you live at more than 1000metres above sea level). Modified the boost limiter map looks like picture as below.
The modified boost limiter map.
Single value boost limiter:
At this point we have set almost everything to get a higher boost except the absolute limiter.That’s the last one we need to change. This value has to be a bit(read 50mbar) higher than the highest turbo map value. So we set this value from 2620mbar up to 2700mbar.
Conclusion:
All information and values given in this document may be used at own risk. I do not stand in for any problems or blown turbo’s. My special thanks go out to Matt and Tomek who helped me with all this information and tuning advice. I hope you enjoy the information.